Fault Tree Analysis (FTA) can be used in industrial systems to find faults, damages, and predictive maintenance. Learn about FTA’s basics.
Setting up a complex machine or a system is challenging, but system failures cause more damage and have significant costs attached to them. It is prudent to analyze how prone the new system is to have any faults or damages. This will help anticipate potential failures and assist in strengthening the system to prevent such identified occurrences.
One method of analyzing the potential avenues of failures for a system is fault tree analysis.
Fault Tree Analysis
Fault tree analysis (FTA) is the method of graphically and mathematically analyzing the origins of faults in a system. The complete system and its subcomponents are mapped as a graphical model. Acyclical graphs are used as the graphical tool for this purpose. It inevitably looks like a tree.
Various situations in which FTA is used include to:
- Test reliability of a system
- Improve reliability of a system
- Identify weakest components
- Identify the strengths of a system
- Root cause analysis
- Add redundancies and spare management systems
- Run risk analysis of complex systems
- Understand safety requirements for infrastructure of national importance.
By studying, inspecting, and brainstorming the graphical models, one can identify how faults propagate through the system. This could serve as a litmus test for the robustness of any system. It also identifies the weakest components or structures in the system. They can be strengthened to increase reliability. Another way to increase reliability is to add redundancies.
Fault Tree Analysis (FTA) in Control Automation
Control automation is generally applied in the most complex and critical systems for a facility or even for a country. Critical infrastructure of national importance like nuclear plants, water distribution systems, oil pipelines, food processing facilities, power plants, and defense systems use control systems and automation in one way or the other.
FTA, as a technique, was developed in 1962 by Bell Telephone laboratories. The company was assigned to design safety systems and protocols for intercontinental ballistic missiles (ICBMs). Failure to such crucial systems can be catastrophic. A commonly used reliability assessment tool at the time was failure mode and effects analysis (FMEA).
FTA emerged when a visual aspect was added to FMEA as acyclical graphs. This made conducting failure analysis easier and precise by adding probability components to all analyses. Adding the graph to create FTA was a remarkable improvement over FMEA.
Complex systems often implemented by control automation can be easily analyzed using FTA. It is done in the design phase before a system is implemented. This helps to ascertain the reliability of a system.
FTA results can provide enough data to build redundancy into the systems. Spare management can be done efficiently to improve reliability, or the system can be completely redesigned if the FTA results do not fit into the recommended risk category. This is easier when FTA is done at the design phase before implementation.
How to Create a Fault Tree Analysis (FTA) Diagram
Boolean logic is applied on a directed acyclic graph to arrive at the Fault Tree of the system. The tree is built using event nodes and gates.
Fault Tree Analysis (FTA) Events
Events are anything that occurs in the system that is being mapped as a fault tree. There are six different types of events.
| Event Symbol | Description |
|---|---|
| ▭ (rectangle) | Top event or intermediate event |
| ○ (circle) | Basic event |
| △ (triangle) | Transfer event |
| ⬦ (diamond/rhombus) | Underdeveloped event |
Figure 1. A table showing FTA event symbols.
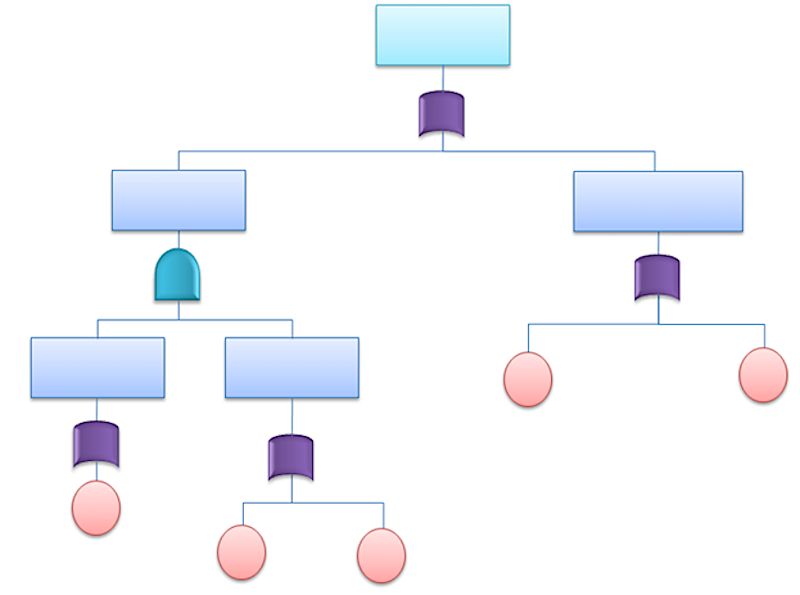
- Top event (TE): The complete system failure whose root cause is reverse engineered with fault tree is the TE. The purpose of a fault tree is to analyze the potential causes for this top event. The symbol used is a rectangle without any output leads.
- Intermediate event (IE): IEs are represented with rectangles with input and output leads. All events between basic events and the TE are intermediate ones. They are caused by a combination of one or more basic events and can eventually lead to the TE.
- Basic event (BE): Circles are used as symbols for BEs. These are the events that do not have any other dependencies and occur on their own without instigation. BEs are the root causes that lead to any other failure in the system.
- Transfer event: Triangles are used to represent transfer events. When FTA used to be done on paper, these symbols signified continuation in different sheets.
- Underdeveloped event: Diamonds or rhombuses represent such events. These are events that do not have sufficient information, but they are not a BE. Such events are called underdeveloped events.
Now that we have covered FTA events, let’s move on to FTA gates.
Fault Tree Analysis (FTA) Gates
The different events are connected with other events and components through gates. They are the same as the gates used in any other boolean logic operations. The most commonly used gates are described below.
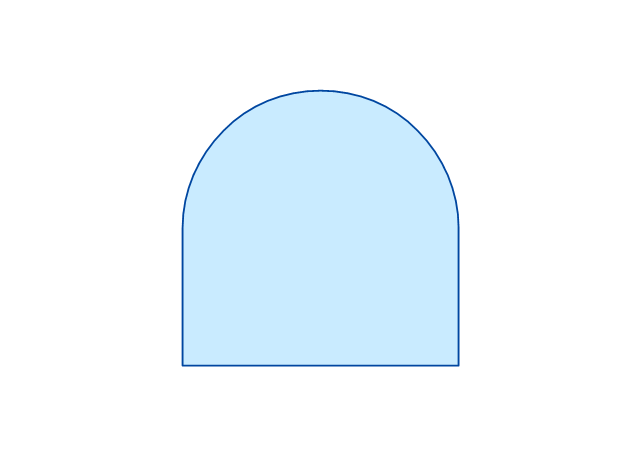
- AND gate: When all the input events for AND gate occurs, the output event occurs. This is the same as the AND gate used in any logic or computing operations.

Figure 2. AND gate.
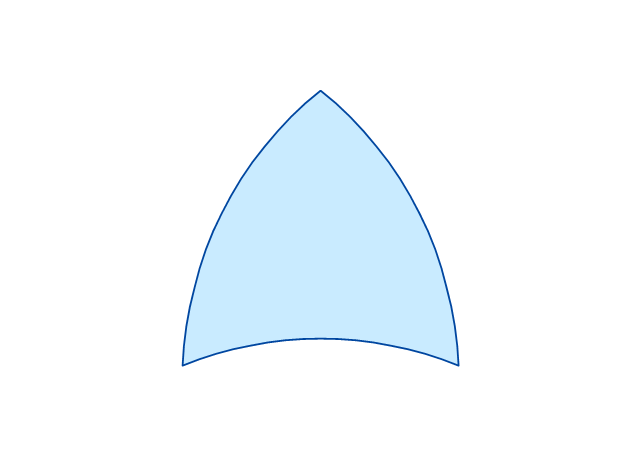
- OR gate: When at least one of the input events occurs, the output event occurs when they are connected through an OR gate.

Figure 3. OR gate.
- Voting gate: If there are N inputs, k number of input events have to occur for the output to activate for a voting gate. They are also called k/N gates.
Other gates that can be used are INHIBIT gate, XOR gate, XAND gate, and any other boolean gates.

Figure 4. A sample structure of a fault tree.
Different Types of Fault Tree Analysis (FTA)
FTA can be broadly classified into two broad categories: qualitative fault tree analysis and quantitative fault tree analysis. They can be further divided into subcategories according to the purpose for conducting FTA and the methods involved.
Qualitative Fault Tree Analysis (FTA)
The main focus of qualitative FTA is not to develop a mathematical model of a system. Qualitative FTA is done to understand the structure and behavior of an engineered system. Depending on the reason for conducting qualitative FTA, it can be subdivided into three.
- Minimal cut set (MCS): The minimum number of component failures that result in system failure is MCS. If a system failure occurs with the failure of a very small number of components, it is not a robust system. Additional redundancies have to be in place to make it more reliable.
- Minimal path set (MPS): MPS identifies the minimum number of components that will sustain the operations of a system. The components identified as MPS will be designed so that they will not fail even in extreme conditions.
- Common cause failure (CCF): If a single component or a subsystem can be the root cause for different cut sets, it poses a vulnerability. CCF techniques identify such components to replace them or provide redundancies in the event of failure.
Quantitative Fault Tree Analysis (FTA)
Qualitative FTA is done to obtain stochastic measures for the system. The result of such an analysis is the overall probability of system failure with the existing structure and components.
Based on these calculations, ranked significance can be given to different cut sets and paths. Since fault trees are created using boolean logic, it is easy to calculate the probability of a system when the probability of failure for each component is known.
The example provided in the next FTA article will throw more light on the calculations involved.
Fault tree analysis is conducted to test the reliability of a system during the design phase. This helps to patch any vulnerabilities of the design. The fault trees are drawn using boolean logic on acyclic graphs that show the weak paths, critical components, and areas of improvement for the system. The probability of failure for the system and subsystems can also be calculated with quantitative FTA techniques. A more detailed discussion of this is in the following article.
Copyright Statement: The content of this website is intended for personal learning purposes only. If it infringes upon your copyright, please contact us for removal. Email: admin@eleok.com
